Introduction
When performing any anterior segment ocular surgery, such as penetrating keratoplasty, cataract surgery, or Nd-Yag capsulotomy, it is crucial to preoperatively assess the retina's visual potential and the neural integrity of the visual system. These tests for potential vision are designed to predict visual outcomes, determine whether the procedure should be initiated, and allow for better patient counseling and managing expectations. There are many ways to test for potential vision. The basis of visual outcome prediction is choosing the proper test and being able to interpret the results. The healthcare team should perform a thorough preoperative workup with appropriate tests for potential vision so that the benefits and risks of the surgery can be weighed.
Definition
Tests for potential vision evaluate whether patients with anterior segment diseases, such as cataracts, can benefit from surgery.[1][2] Tests for potential vision also evaluate the integrity of the retina and neural integrity of the visual system. Macular function tests are an important part of evaluating potential vision.
Test Classification
1. Visual acuity
Accurate visual acuity testing is the starting point for all potential vision tests.
2. Tests that indicate anterior segment disease
While these are not, by definition, tests for potential vision, they allow the practitioner to determine the contribution of corneal disease and cataracts to vision loss.
- Rigid gas permeable contact lens over-refraction: If vision improves with this test, then corneal irregularity is the cause of vision loss.[3]
- Corneal topography and pachymetry: If corneal irregularity and/or thinning are detected, the cornea may cause vision loss.
- Brightness acuity testing: If glare testing reduces vision, corneal or lenticular opacities are more likely to cause vision loss.
- Refraction: If the refractive error rapidly changes, especially if a myopic shift is observed, this indicates corneal disease or a cataract.
- Slit lamp biomicroscopy: This test allows the practitioner to detect disease of the anterior as well as a posterior segment. If anterior segment disease is the sole cause of vision loss, the practitioner's clarity when viewing the fundus should equal the patient's visual acuity.
3. Potential vision tests categorization based on media clarity
Tests in Mildly Opaque Media
- Contrast sensitivity - Helps detect defects in vision earlier than visual acuity.
- Photo stress test: This test helps in gross evaluation of retinal function, specifically the time taken for retinal pigment regeneration.
- Color vision - Evaluates the function of the cones in the macula. Certain types of color vision deficiency may indicate optic nerve disease.
- Amsler grid - Evaluates the integrity and shape of the macula.
- Two–point discrimination - Helps assess retinal function in uncooperative patients.
- Microperimetry - Helps in the mapping of scotomas.
- Fundus fluorescein angiography - Evaluates the retinal vasculature.
- Optical coherence tomography - Evaluates the shape and integrity of the macula and optic nerve.
Tests in Significantly Opaque Media
- Maddox rod test - Gross test for detection of macular disease.
- Focal Electroretinogram - Evaluation of retinal pigment epithelium, rods and cones, and bipolar cells.
- Laser interferometry - Evaluates the retina using fringe patterns.
- Visual evoked potential - Measures the electrical signal generated at the visual cortex in response to the visual stimuli.
- Entopic phenomenon - The visualization of reproducible visual perceptions that arise within the eye due to intraocular blood vessels, opacities in the media, colored halos, or phosphenes.
- Critical fusion/flicker frequency - Evaluates the crucial flicker fusion threshold.
4. Potential Vision Test Categorization Based on Subjectivity
Subjective Tests
- Colour vision
- Photostress test
- Amsler grid
- 2-point-discrimination
- Entopic phenomenon
- Maddox rod test
- Laser interferometry
- Potential acuity meter - projects an image on the retina and bypasses opacities in the anterior segment.
Objective Tests
- Pupillary evaluation - a gross test of the function of the retina and optic nerve.
- Visual evoked potential
- Electroretinogram
Specimen Collection
Register For Free And Read The Full Article
 Search engine and full access to all medical articles
- 10 free questions in your specialty
- Free CME/CE Activities
- Free daily question in your email
- Save favorite articles to your dashboard
- Emails offering discounts
Learn more about a Subscription to StatPearls Point-of-Care
Specimen Collection
Tests for potential vision gather data starting from the retina up to the visual cortex. While some tests, like the electroretinogram, test the photoreceptors and bipolar cells, others, like the visually evoked potential, test the entire visual pathway up to the visual cortex. They allow for the evaluation of the integrity and functioning of the visual system.
Procedures
Visual Acuity
Although this is not a test for potential vision, it is a test that needs to be performed at the very beginning of the ocular examination.[4] Visual acuity is defined as the reciprocal of the minimum resolvable angle. It is a subjective method of assessing macular function. Different components of visual acuity include distance vision, near vision, color vision, and contrast sensitivity, which can be measured using different methods.[5]
- Distant vision – Snellen chart, Landolt C chart, Sheridan Gardiner HOTV test.[6]
- Near vision – Jaeger chart, Roman chart, and Snellen near vision chart.[7]
- Color vision – Ishiharas pseudoisochromatic plates, Farnsworth Munsell 100 Hue test, Green lantern test and Anomaloscopes.[8]
- Contrast sensitivity – Pelli-Robson, Regan, Arden-Grating charts.[9][10]
Brightness Acuity Test
It is a subjective test that can be performed in clear or slightly opaque media.[11] A simple device is used to test glare disability. The device can simulate 3 bright light conditions, which are as follows:
- Direct overhead sunlight - the high setting of the device
- Partly cloudy day - medium setting
- Bright overhead commercial lighting - low setting
Visual acuity is measured in all 3 conditions, and if reduced in comparison to the baseline acuity, the patient is said to have a glare disability. Glare disability is usually seen due to anterior segment pathologies like cataracts, whereas posterior segment diseases does not cause a significant deterioration in vision on exposure to light.
Photostress Test
It is a subjective test that can be performed in clear media and in the presence of media opacities.[12] It tests only the retinal function and is independent of the rest of the visual pathway. It measures the Photostress Recovery Time (PSRT). PSRT is defined as the time it takes for the visual acuity to return to baseline after the photoreceptors in the retina have been bleached by a bright light source. When a bright light falls on the retina, the visual pigments are bleached, producing retinal insensitivity, which is perceived as a scotoma. The PSRT is the time needed to regenerate the visual pigment, which causes the scotoma to disappear.
Procedure
- The distant visual acuity of both eyes is measured.
- The patient is asked to remove their spectacles.
- The bad eye is occluded, and the normal/better eye is tested first
- A direct ophthalmoscope or any other bright light source is held 2 to 3 cm in front of the eye being tested.
- The patient is asked to look directly at the light turned off after 10 seconds.
- The patient is asked to wear spectacles and read 1 line above the original visual acuity on the distant vision chart as soon as the after images disappear and the optotypes are visible.
- The time taken to read 2 or 3 optotypes is recorded as the PSRT.
- The same procedure is repeated for the other eye.
Amsler Grid
It is a subjective test that can be performed in clear media and in mild media opacities.[13] It is a grid of horizontal and vertical lines that monitors a person's central 20 degrees of the visual field. It can be an alternative to a central 10-degree visual field test. There are 7 Amsler charts that can be used for home monitoring of macular disease.
- Chart 1/ Standard grid – It tests the general subjective response to distortions in the pattern. It consists of 400 small squares, each measuring 5 mm and subtending 1 degree on the retina when held at 30 cm. It also has a central white dot. If the patient cannot see the white dot, they can be considered to have a central scotoma.
- Chart 2 – It is used if the patient has a central scotoma, as tested by chart 1. It looks like chart 1 but has 2 diagonal white lines across the grid. These diagonal lines help determine the limits of the central scotoma.
- Chart 3 – It is primarily used to detect color scotomas and can also be used to check color desaturation in optic nerve diseases. It can also be used along with red–green dissociative glasses in patients with suspected malingering. It consists of a similar grid as found in chart 1, with the only difference being that the lines of the grid are red.
- Chart 4 – It is used to differentiate between a scotoma and metamorphopsia, which can be seen in macular edema.
- Chart 5 – It is used in patients with metamorphopsia to identify the specific meridians that are affected. It has parallel lines with a central white dot for fixation. The chart can be rotated to change the meridian.
- Chart 6 – It is used for detailed central evaluation. It is the same as chart 5, with the only difference being that the parallel lines are placed closer to each other, 0.5 degrees above and below the fixation point.
- Chart 7 – It is used to diagnose subtle macular diseases. It has a fine central grid where each square measures 2.5 mm and subtends 0.5 degrees when held at 30cm. This grid can be used to evaluate the central 8 degrees of the visual field.
Procedure
- The patient is seated, and an appropriate near add is given, enabling visualization at 30 cm. Multifocal/progressive addition lenses should be avoided.
- The test is performed for each eye separately. The non-viewing eye is occluded.
- The appropriate chart is held at 30 cm with the ambient room lights switched on. The patient is asked to fixate on the center of the grid and then determine whether all 4 corners are still visible. Then, the patient is asked whether any of the squares in the grid look blurry or wavy.
- The test is repeated with any of the other charts deemed appropriate.
- The patient records the defects by drawing any findings directly on the Amsler recording sheet or by the doctor based on the patient's explanation.
2-Point Discrimination
It is a subjective test for the potential vision, requiring clear media.[14] It is ideal for kids and uncooperative patients but can be done on anyone. Two illuminated light points of 2 mm diameter are held 2 inches apart, 2 feet away from the patient. If the patient can distinguish the 2 lights separately, there is good retinal function.
Entoptic Phenomenon
It is a subjective test that can be performed even in opaque media.[15][16] It is the visualization of reproducible visual perceptions that arise within the eye due to intraocular blood vessels, opacities in the media, colored halos, or phosphenes. The opacities far from the retina are not perceived as their umbral shadows do not reach the retina.
The opacities closer to the retina are perceived as their umbral shadows are projected on the retina. Normally, blood vessels on the retina are not visualized as the photoreceptors below them are adapted to the reduced level of illumination. However, if the light is thrown at an unusual angle, the shadow of the blood vessels falls on unadapted photoreceptors and thus becomes visible. These visible blood vessels are called the Purkinje tree, and this technique is called the Purkinje tree entoptic test.[17]
Procedure
- Transillumination method – A small flashlight is placed over the closed eyelid at the lateral canthus. The light is constantly oscillated to prevent local adaptation.
- Pinhole disc method: The patient is made to look at a bright background through a pinhole in a constantly moving disc.
- Blue field entopic phenomenon – The patient is asked to look at a bright and diffusely illuminated surface with accommodation relaxed. The background is illuminated by blue light (350 to 450 nm), which is maximally absorbed by hemoglobin.
- The patient can see luminous spots that move in patterns similar to the retinal capillaries. These are believed to be red blood cells because:
- No spots are seen in the area corresponding to the foveal avascular zone.
- The movement occurs in curved, sinusoidal patterns that simulate capillary loops of the vascular tree.
- The movement ceases if intraocular pressure is raised above 50 mm of Hg.
- They are best seen at 350 to 450 nm, the peak absorption wavelength of hemoglobin inside red blood cells.
Maddox Rod Test
It is a subjective test that can be performed even in opaque media.[18] A Maddox rod consists of a set of toric lenses that convert a point source of light to a line. It is usually used to diagnose different types of strabismus.
Procedure
- The patient is made to sit 6 meters away from a light source.
- A Maddox rod is placed in front of the eye to be examined monocularly. The Maddox rod converts the point source of light to a line seen by the patient.
- The Maddox rod is rotated vertically, horizontally, and obliquely, and the patient is asked in what direction the line is oriented and whether it is continuous or not.
Potential Acuity Meter
It is a subjective test that can be performed even in opaque media. It is designed to check the visual acuity due to the retina, bypassing the lens and the cornea. It is a device that attaches to the slit lamp and emits a 0.15 mm diameter point light source in the pupillary plane that is aimed through the clear portions of the cataractous lens.[19]
It is useful in predicting the post-operative visual outcome after cataract surgery in patients with retinal pathologies like dry age-related macular degeneration and those with choroidal neovascularization.[20][21] The potential acuity meter (PAM) can also predict vision after Nd-Yag capsulotomy in patients with posterior capsular opacity.[22]
Procedure
- The pupil is dilated before the test to allow the light to pass through different parts of the lens.
- The patient is seated at a slit lamp, and the PAM projects a miniature Snellen chart through the less dense parts of the cataract.
- The patient is asked to read the Snellen letters of different sizes.
Advantages
- The PAM shows a strong correlation with post-operative Snellen visual acuity.[20]
- It is easy to use and easy to explain to the patient.
Laser Interferometry
It is a subjective test that can be performed even in the presence of opaque media.[23] It can predict acuity up to 20/20. Laser interferometry uses 2 coherent light beams to create a 3-dimensional interference fringe on the retina.[24][25] Different acuities can be predicted by varying the distance between the 2 light beams.
The different models available are:
Procedure
- The patient's pupil is dilated.
- The interferometer is used to project a fringe pattern onto the retina.
- The patient is asked to recognize the direction of the fringes – vertical, horizontal, or oblique.
- The fringes are made finer until the patient is unable to identify the orientation.
- The endpoint fringe pitch is noted and correlated to Snellen visual acuity using a chart provided.
Advantages
- Unaffected by the optics of the eye.
- Easier to use
- More accurate than PAM in predicting visual acuity in patients with a macular hole [28]
Critical Flicker Fusion Frequency
It is a subjective test that can be performed in opaque media. Critical flicker fusion frequency (CFF or CFFF) is the frequency at which flickering light can be perceived as continuous. It is used to assess the processing of temporal vision.[29] The critical flicker fusion threshold (or threshold for flicker fusion, TFF), which denotes the fastest rate of flickering light the visual system can see, is used to characterize visual processing. During the CFF test, the patient is asked to fixate on a light-emitting diode that emits light that oscillates at a gradually increasing frequency. The patient is then asked to press a button when they believes the light to be continuous. Critical flicker fusion thresholds are reduced in retinal and neural diseases but resistant to degradation due to media opacities.[30]
Electroretinogram
An electroretinogram (ERG) is an objective test that can be performed even in opaque media.[31] It records the changes in the eye's resting potential caused by a flash of light and sums up the action potentials of the retina. As a test for potential vision, an ERG can record the integrity of the rods and cones, bipolar cells, and retinal pigment epithelial cells.
Procedure
- Three electrodes are placed on the patient –
- Active electrode – corneal contact lens, gold wick electrodes in the conjunctival sac, or gold foil electrodes on the eyelids.
- Reference electrode – placed at the lateral canthus.
- Ground electrode – placed at the nasal canthus.
- A Ganzfeld stimulus is used to stimulate the retina, and the changes in the resting potential are recorded as a graph.
- A scotopic ERG is first performed after pupil dilation and after dark adaptation for 20 mins. Increasing intensities of the stimulus are presented to the retina. The recordings obtained are referred to as the dark-adapted ERG.
- After 10 minutes of light adaptation, a photopic ERG is performed. Increasing intensities are presented to the retina, and the light-adapted ERGs are recorded.
- There are different types of ERGs –
- Full-field ERG/ Ganzfeld ERG – there is uniform stimulation of the whole retina.
- Pattern ERG – records the macular response to an alternating checkerboard stimulus.
- Multifocal ERG – It records the response of the central 40 to 50 degrees of the retina to a 61-103 hexagonal foci stimulus.
Visually Evoked Potentials
It is an objective test that can be performed in cloudy media.[32] It is an electroencephalogram taken from the visual cortex. Since the macula has the largest representation within the visual cortex, the visually evoked potentials (VEP) produce a macula-dominated response. The test cannot localize the pathology but, instead, is an indicator of the integrity of the visual system.
Procedure
- Scalp electrodes are usually placed in the occipital area as it is closest to the visual cortex. There are 2 systems of placement:
- 10-20 international system
- Queen square system
- The waves produced by the visual stimulus are then recorded as a graph.
- There are different types of VEP:
- Flash VEP – flash stimuli are presented to the eye at a rate of 1 to 5 times/second. The VEP indicates whether the stimulus was perceived by the cortex or not. It is the test of choice in infants as it can be done even during sleep.
- Pattern VEP – checkerboard patterns displayed on a screen are used as stimuli. This can be used to roughly estimate the visual acuity.
Slit Lamp Biomicroscopy
It is an objective technique that can determine the expected visual acuity in the presence of a cataract.[33][34] If reduced visual acuity is exclusively caused by the ocular media (corneal opacity, cataract, vitreous debris), then the doctor's view of the ocular fundus should be equal to the patient's visual acuity. For example, if the patient's visual acuity is 20/100, but the doctor's view of the fundus is 20/40, then there should be a suspicion that the ocular media is not the only cause of reduced visual acuity. Additionally, the brightness, shape, direction, and angle of illumination of the slit lamp can be adjusted to view all the different structures of the anterior segment of the eye. It can also be used to visualize the posterior segment. The most accurate testing requires the pupil to be fully dilated and also requires condensing lenses to enable seeing the fundus. The different lenses that can be used are as follows:
- Hruby lens biomicroscopy - It is a planoconcave lens of 58.6 dioptre power. A virtual and erect image of the fundus is produced. The image has a low magnification, and the field of view is small. The fundus cannot be visualized beyond the equator.[35]
- Contact lens biomicroscopy -
- Indirect fundus biomicroscopy - It is a method of noncontact fundus biomicroscopy. A +78 Dioptre or a +90 Dioptre lens can be used to produce a real, inverted, and magnified image.
Fundus Fluorescein Angiography
Fundus fluorescein angiography (FFA) is an objective technique that requires clear media to perform.[37][38] It can also be performed in the presence of mild media opacities. It is a diagnostic technique that uses systemic fluorescein dye to allow sequential visualization of blood flow simultaneously through the retina, choroid, and iris tissue.
Procedure
- The fundus camera is correctly aligned, and the eyes are dilated.
- Baseline red-free images are taken.
- A 21-gauge butterfly needle is inserted into the antecubital vein, and the fluorescein dye is injected at 1 ml/sec.
- A timer is started, and photos are taken starting 15 seconds before the dye is injected and lasting 10-20 min.
Optical Coherence Tomography (OCT)
Although media opacities deteriorate the image, OCT is often used to determine the integrity of posterior segment structures such as the macula and the optic nerve. It is an objective method that may be done in the presence of slightly opaque media but not in the presence of dense cataracts.[39]
By screening for posterior segment pathologies in eyes with cataracts, the OCT can detect if the macula, retina, and optic nerve are contributing to reduced visual acuity. It produces cross-sectional images of biological tissues with less than 10-micron axial resolution. A near-infrared beam of light is projected onto the retina. The light reflected from the retinal microstructures is scattered. The echo time delay of the scattered light is compared with the echo time delay of the light reflected from the reference mirror.
Microperimetry
It is an objective test that requires clear media to perform.[40] It can also be performed in patients with cataracts to evaluate for macular dysfunction. Microperimetry enables precise topographic correlation between that point's retinal threshold and fundus features. By providing real-time input from the color fundus image, the equipment enables precise positioning of the perimetric target on the fundus area of interest. Microperimetry is primarily a research tool, not a tool utilized in everyday clinical practice.
The following are some potential clinical uses:
- When macular scotomas are measured carefully, the clinician can identify a patient's fixation pattern. This makes implementing different treatment modalities, such as eccentric viewing techniques, and monitoring the pathology's functional impact easier.
- Once the focus pattern is recorded, planning and rehabilitation with low-vision aids can proceed more effectively.
- Research methods compare microperimetry and OCT evaluation of macular disorders to investigate the relationship between physical alterations and their functional importance.
Procedure
- The test can be carried out in low light with an undilated pupil.
- The first stage is to align the fundus image with the target such that when a target is later projected on the photograph of the fundus at a particular position, the stimulus is automatically presented to the patient at that exact actual fundus location.
- The ambient lighting is set to 4 apostilbs. The stimulus volume range is 0 to 20 dB, and the Goldmann I to V sizes are in this range.
- Depending on the patient's visual acuity, the fixation target might vary in size and form, but it is typically 100 apostilbs.
- Either numerical data or a color scheme is used for reporting.
Indications
Potential Diagnosis
Potential vision testing allows the clinician to determine the cause of vision loss better when media opacities are present in combination with other possible visual system disorders. These other disorders include:
- Macular disease
- Optic nerve disease
- A brain disorder affecting the visual tracts and the visual cortex
- Amblyopia
- Malingering
- A patient who is unable to respond or cooperate with a regular vision test
- A patient with non-organic vision loss [14]
Media opacities that can be distinguished include:
- Cataract
- Posterior capsular opacity
- Corneal opacity
- Corneal irregularity
- Vitreous opacities such as hemorrhage
Thorough knowledge of tests of potential vision allows the healthcare team to determine the most appropriate medical intervention, weigh the benefits and risks of surgery, and allow for appropriate counseling of patients.
Normal and Critical Findings
Photostress Test
If the photostress recovery time (PSRT) of the worse eye is equal to that of the better eye, then the macula is not the cause of vision loss. Since the test is independent of media opacities and brain disorders cause bilateral vision loss, such a result would narrow down the vision loss to an optic nerve disorder.
- If the PSRT of the worse eye is longer than that of the normal/better eye, then the vision loss is due to macular disease.
- PSRT greater than 50 seconds is considered abnormal.
Amsler Grid
- If the central white dot is not seen, the patient has a central scotoma. The extent of the scotoma is described with the help of the diagonal lines on Amsler chart 2.[44]
- If all 4 corners of the grid in any of the charts are not seen, the patient has a large scotoma.
- If the central white dot is seen, but any boxes are blurry or missing, the patient has a peripheral scotoma or eccentric viewing.
- If any lines appear wavy or distorted, the patient has metamorphopsia due to macular diseases such as edema, drusen, or epiretinal membrane.
2-Point Discrimination
The macular function is normal if the patient can perceive 2 different lights.
Maddox Rod Test
- Grade 1 response - The patient can identify the direction correctly in all 3 positions. The line appears straight, continuous, and correct in color in all 3 positions. It indicates 6/6 to 6/9 vision.
- Grade 2 response - The patient can identify the direction correctly in all 3 positions. The line appears straight but broken and correct in color in all 3 positions.
- Grade 3 response - The patient can correctly identify the direction and the color but is unsure whether the line is straight or not.
- Grade 4 response - The patient can correctly identify only color.
Entoptic Phenomenon
The macular function is probably normal if the patient can perceive shadows of the arborizing retinal vasculature. The macular function is probably poor if they cannot perceive the vasculature.[45] In the blue field entoptic phenomenon test, more than 15 corpuscles are normally seen. The retinal function is abnormal if there is a partial loss in movement, a complete loss, or slow movement.
Potential Acuity Meter (PAM)
The smallest Snellen line where the patient can read 3 or more characters is recorded as the potential acuity.
Laser Interferometry
The gratings (also called spatial frequency) are made finer until the patient cannot discern the direction of the gratings. The smallest gratings the patient sees are recorded and then converted to Logmar or Snellen acuity. A spatial frequency of 30 per degree equals 20/20 (6/6) visual acuity.[46]
Critical Flicker Fusion Frequency (CFFF)
The critical flicker fusion threshold (or threshold for flicker fusion, TFF), which denotes the fastest rate of flickering light that the visual system can see, is used to characterize the upper degree of one's ability in visual processing. This is what is used to determine visual acuity. While, according to certain sources, the human eye can detect the difference between modulated and steady light at up to 500 Hz, it is generally accepted that the human eye cannot detect flicker above 50 to 90 Hz.[47]
Electroretinogram
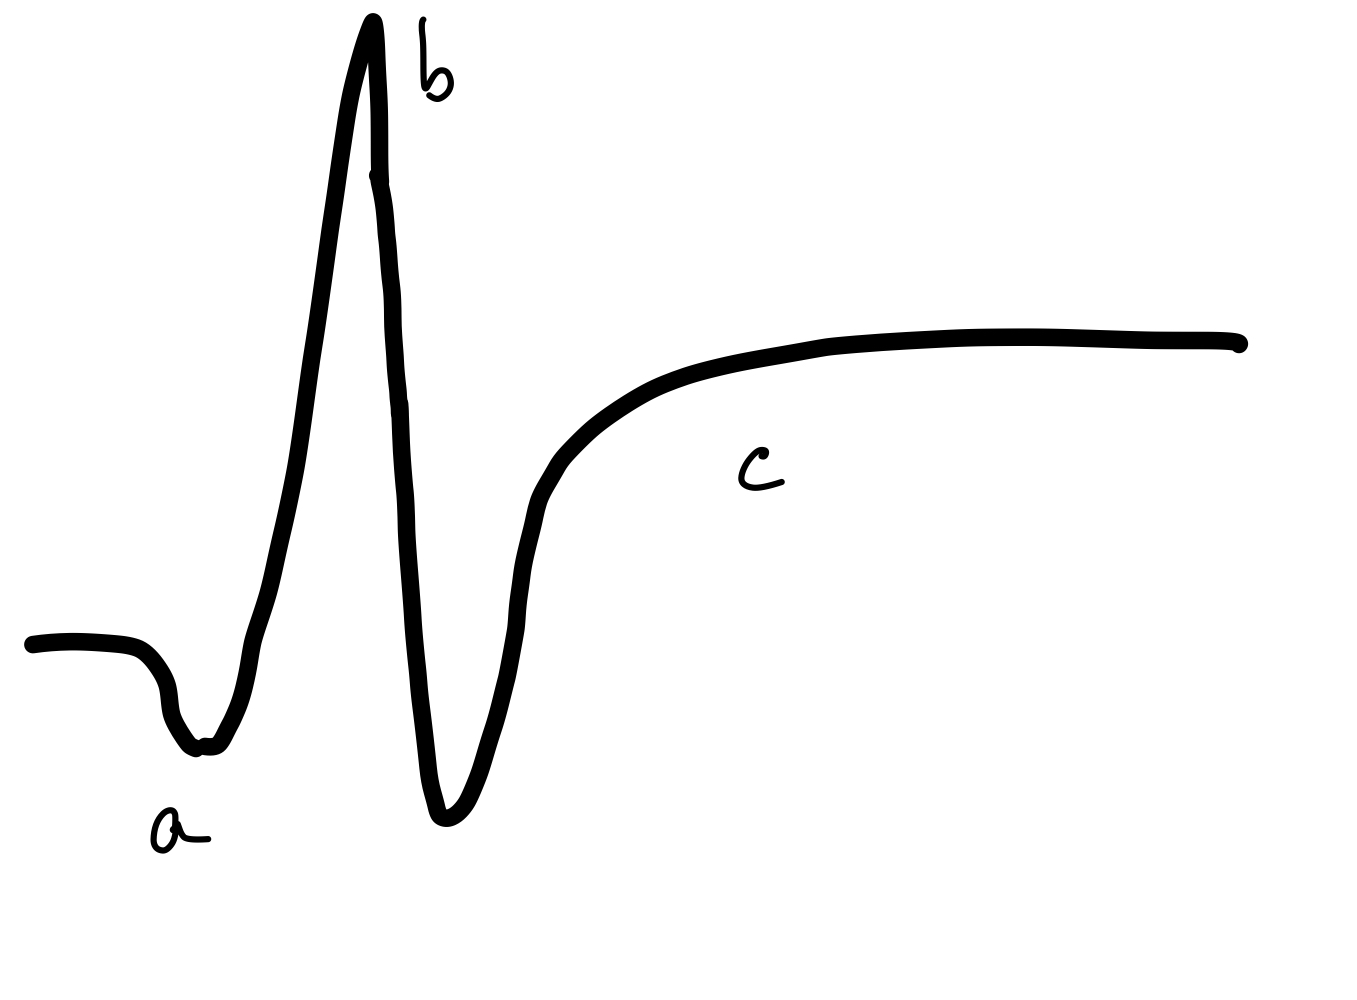
The normal ERG has 3 waves:
- A wave – a small negative wave that originates from the photoreceptors
- B wave – a large positive wave that originates from the bipolar cells
- C wave – a slow-rising positive wave originating from the Retinal pigment epithelial cells (see Figure. Normal Electroretinogram) [48]
These components are measured using the following parameters:
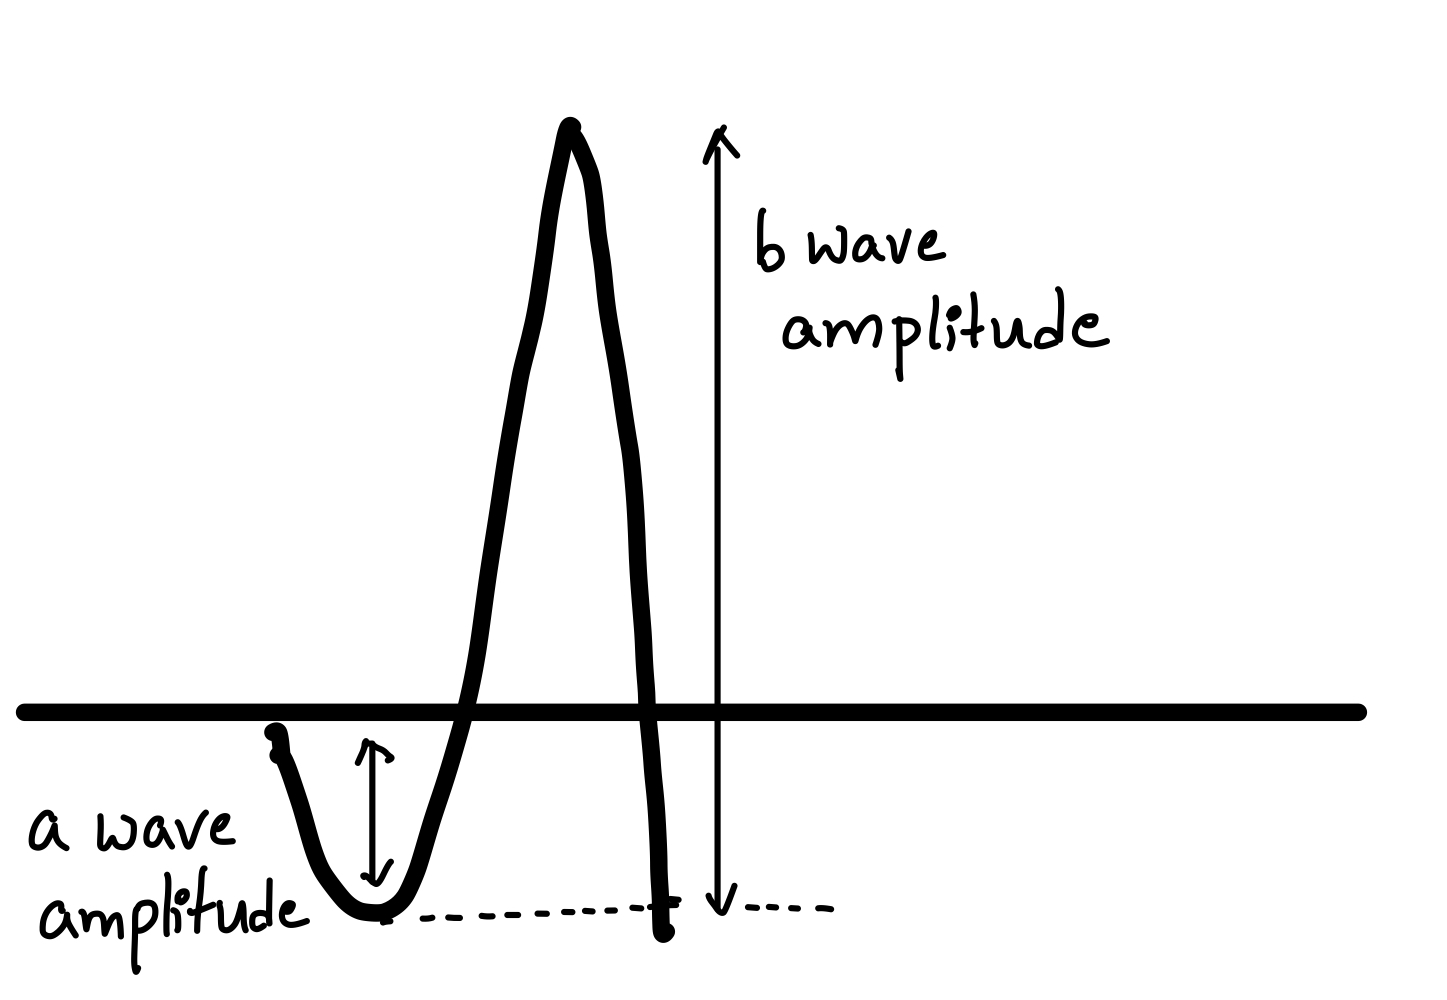
- Amplitude – a measure of the maximum deviation. See Figure. Amplitude of Electroretinogram Waves.
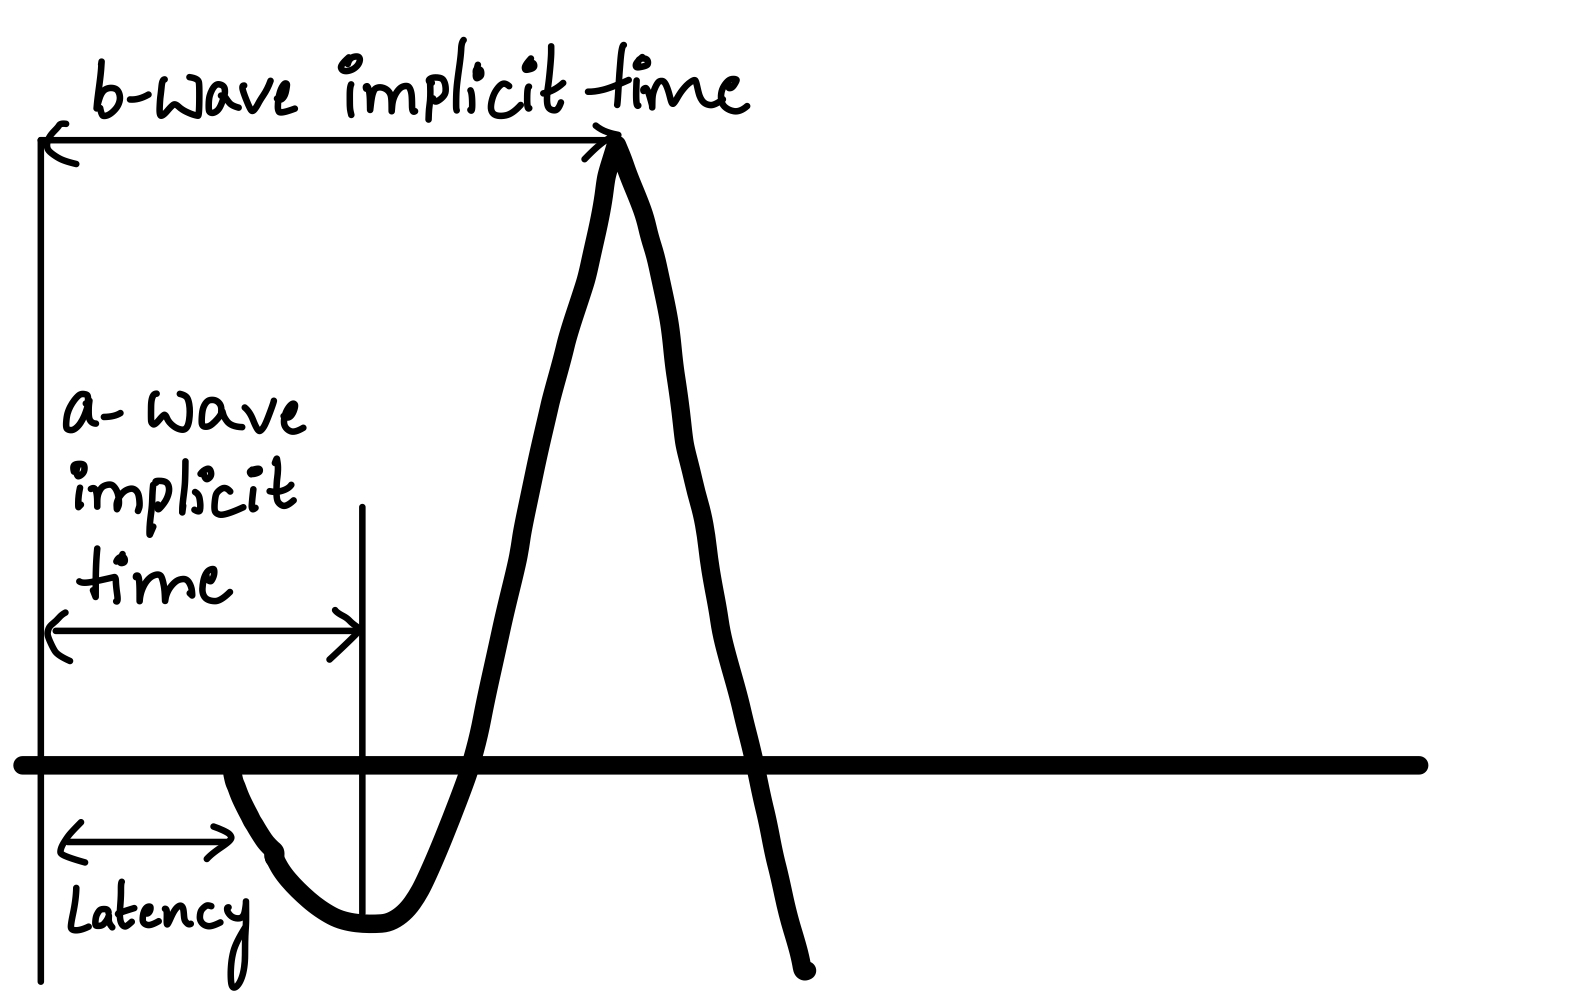
- Implicit time – The time interval between the onset of the stimulus and the maximum response of a or b wave.
- Latency – The time interval between the onset of the stimulus and the start of a wave. See Figure. Time Response of Electroretinogram Waves.
These parameters from the patient are compared to normal ERGs to diagnose the status of the retina.
Visually Evoked Potentials
- The VEP is a series of many waves, among which the following are used for clinical diagnosis:
- P100 wave – a positive wave that occurs at approximately 100 ms after photostimulation
- N75 wave – a negative wave that occurs at approximately 75 ms after photostimulation
- N135 wave - a negative wave that occurs at approximately 135 ms after photostimulation
- In each wave, the amplitude and the latency are compared with the normal VEP.
- If the largest amplitude fastest waves are produced with a checkerboard stimulus with 5-6mm squares, the visual acuity can be estimated at around 20/20.
- If the largest amplitude fastest waves are produced with larger squared checkerboard stimuli, the visual acuity is correspondingly lower.[32]
Fundus Fluorescein Angiography
The normal fundus fluorescein angiography (FFA) has the following phases:
- Prearterial/Choroidal Phase - occurs 9.5 - 10 sec after dye injection. The posterior ciliary artery and choriocapillaris fill during this phase.
- Arterial Phase - occurs 10 - 12 sec after injection of the dye. The central retinal artery fills during this phase.
- Capillary/Early Arteriovenous Phase - occurs 13 - 15 sec after dye injection. The precapillary arterioles and capillaries fill during this phase.
- Late Arteriovenous/Lamellar/Early Venous Phase - occurs 14 - 16 sec after dye injection. The post-capillary venules fill during this phase.
- Venous Phase - occurs 17 - 19 sec after injection.
- Late Staining/Recirculation Phase - occurs 10 mins after injection of the dye—the disc margin and Bruch's membrane stain during this phase.[49]
Hypofluorescent areas visualized are due to the following:
- Blocked fluorescence - Vitreous hemorrhage, subhyaloid hemorrhage, intraretinal hemorrhages, lipofusceine deposits like drusen, etc, block the underlying retinal and choroidal fluorescence.
- Vascular filling defects - Retinal venous and arterial occlusions prevent the dye from flowing through the vessels, producing hypofluorescence.
Hyperfluorescent areas visualized are due to the following:
- Pre-injection fluorescence - due to auto or pseudo-fluorescence.
- Early hyperfluorescence is due to abnormal retinal or choroidal vessels
- Late/extravascular hyperfluorescence is due to new vessels on the discs, vitreous inflammation, and cystoid edema.
Optical Coherence Tomography
The optical coherence tomography (OCT) scan allows cross-sectional imaging of the macular and peripapillary regions. The scans are color-coded, with red-yellow representing areas of maximal optical reflection and backscattering and blue-black representing areas of minimal signals. The vitreous is seen as a non-reflective dark space. The vitreoretinal interface is well-defined as the difference between the non-reflective vitreous and the backscattering retina. Layers within the retina can be seen separately, with each layer being discernible.
Microperimetry
The green hue symbolizes a low-intensity stimulus corresponding to high sensitivity, while the red represents a high-intensity stimulus (low sensitivity). An empty square represents a stimulus that is not seen, whereas a filled square represents a seen stimulus.[50]
Interfering Factors
Subjective Tests
Tests that require a patient response, such as potential acuity meter, laser interferometry, and critical flicker fusion frequency, may be interfered with by:
- Patient cooperation
- Malingering
- Hysterical blindness
Clear Media Tests
The presence of opacities can interfere with the results of tests that require clear media, such as OCT, FFA, and microperimetry.
Photostress Test
The procedure is not standardized, and variables influencing the PSRT include the brightness of the light used and the length of exposure.
Amsler Grid
- It is a personal chart, and often, attention is not paid to a rote task performed routinely daily.
- A completion phenomenon occurs, which can compromise the patient's perception of the scotoma/metamorphopsia. This phenomenon occurs when the cortex perceptually fills small gaps in line stimuli.
- The test relies heavily on maintaining central fixation and, therefore, cannot be used in children or patients with very poor vision.
- Incorrect working distance, near corrections, performing the test binocularly, or wearing glasses - such as bifocals - that distort lines are all sources of error that can affect the test outcome.[44]
Potential Acuity Meter
- Being a subjective test, it is heavily dependent on patient compliance.
- It is less accurate in cases with denser cataracts.
- It overestimates vision in cystoid macular edema and retinal detachment.[51][52]
- In patients with severe glaucomatous damage, the results of PAM are not accurate.[53]
Laser Interferometry
Complications
- In all tests: Erroneous results may lead to incorrect conclusions, resulting in unnecessary surgery.
- Photostress test: Over-exposure of the retina leads to damage to the photoreceptors.
- Electroretinogram: Corneal abrasions due to the contact lens.
- Amsler grid: The completion phenomenon causes the visual system to mask important results, leading to delayed diagnosis.
- Fundus fluorescein angiography - local tissue necrosis due to extravasation of the dye, photosensitivity to the die, change in urine color, urticaria, dye-related anaphylaxis, and death.
Patient Safety and Education
The results from most of these tests can, in most cases, be communicated immediately to the patient. One of the main indications for the tests for potential vision is to manage patient expectations regarding the visual outcome of surgery. It is important to ensure that the patients understand the results of these tests as they indicate the surgery's outcome. This makes testing for potential vision an important tool in patient safety and education. Explaining the procedure is important, as patient cooperation affects most results.
Clinical Significance
Tests for potential vision are performed preoperatively to predict whether patients with anterior segment diseases, such as cataracts, can benefit from surgery. These tests also evaluate the integrity of the retina and the neural visual system. Several of these tests can evaluate the macula's function in cases with dense cataracts where the posterior segment cannot be visualized. If a macular or retinal disease is present in such a patient, the postoperative vision after cataract surgery depends on the remaining visual function of the macula and, thus, may be less than optimum. This is useful in counseling and managing patient expectations after surgery. Another application of these tests can be estimating visual acuity in patients with hysterical blindness, children, and uncooperative, nonverbal, or unconscious adults.
Some tests, like the ERG, specifically evaluate the integrity of the retinal pigment epithelium, photoreceptors, and bipolar cells. Others, like VEP, test the intactness of the entire visual system, starting from the retina and reaching up to the visual cortex. The Photostress test, Maddox rod, 2-point-discrimination test, and entoptic phenomenon can be used as gross screening methods in the outpatient setting. The Amsler chart can be administered to monitor macular disease at home. Thus, tests for potential vision are important tools for examining patients with less than 20/20 vision; hence, understanding their principles and learning to administer them is crucial.
Media
(Click Image to Enlarge)
Normal Electroretinogram.
Contributed by P Parthasarathi, MD
(Click Image to Enlarge)
Time Response of Electroretinogram Waves.
Contributed by P Parthasarathi, MD
(Click Image to Enlarge)
Amplitude of Electroretinogram Waves.
Contributed by P Parthasarathi, MD
References
Sherman J, Davis E, Schnider C, Bass S, Nath S, Cohen J. Presurgical prediction of postsurgical visual acuity in patients with media opacities. Journal of the American Optometric Association. 1988 Jun:59(6):481-8 [PubMed PMID: 3403893]
Level 3 (low-level) evidenceMinkowski JS, Guyton DL. New methods for predicting visual acuity after cataract surgery. Annals of ophthalmology. 1984 Jun:16(6):511, 513-6 [PubMed PMID: 6742691]
Smiddy WE, Horowitz TH, Stark WJ, Klein P, Kracher GP, Maumenee AE. Potential acuity meter for predicting postoperative visual acuity in penetrating keratoplasty. A new method using a hard contact lens. Ophthalmology. 1987 Jan:94(1):12-6 [PubMed PMID: 3550564]
Wesemann W,Heinrich SP,Jägle H,Schiefer U,Bach M, [New DIN and ISO norms for determination of visual acuity]. Der Ophthalmologe : Zeitschrift der Deutschen Ophthalmologischen Gesellschaft. 2020 Jan; [PubMed PMID: 31346702]
Roth A, Pelizzone M. [Examination of central vision. Visual acuity, contrast sensitivity, color vision]. Klinische Monatsblatter fur Augenheilkunde. 1989 May:194(5):325-32 [PubMed PMID: 2664322]
Caltrider D, Gupta A, Tripathy K. Evaluation of Visual Acuity. StatPearls. 2025 Jan:(): [PubMed PMID: 33231977]
Bailey IL, Lovie JE. New design principles for visual acuity letter charts. American journal of optometry and physiological optics. 1976 Nov:53(11):740-5 [PubMed PMID: 998716]
Level 3 (low-level) evidenceJolly JK, Pratt L, More AK, Kwan J, Jones RL, MacLaren RE, Aslam S. The Effect of Cataract on Color Vision Measurement with the Low-Vision Cambridge Colour Test: Providing an Adjustment Factor for Clinical Trials. Ophthalmology science. 2022 Jun:2(2):100153. doi: 10.1016/j.xops.2022.100153. Epub 2022 Apr 8 [PubMed PMID: 36249699]
Zimmerman AB, Lust KL, Bullimore MA. Visual acuity and contrast sensitivity testing for sports vision. Eye & contact lens. 2011 May:37(3):153-9. doi: 10.1097/ICL.0b013e31820d12f4. Epub [PubMed PMID: 21378574]
Kaur K, Gurnani B. Contrast Sensitivity. StatPearls. 2024 Jan:(): [PubMed PMID: 35593849]
Holladay JT, Prager TC, Trujillo J, Ruiz RS. Brightness acuity test and outdoor visual acuity in cataract patients. Journal of cataract and refractive surgery. 1987 Jan:13(1):67-9 [PubMed PMID: 3559957]
Margrain TH, Thomson D. Sources of variability in the clinical photostress test. Ophthalmic & physiological optics : the journal of the British College of Ophthalmic Opticians (Optometrists). 2002 Jan:22(1):61-7 [PubMed PMID: 11824648]
Jivrajka RV, Kim JK, Fink W, Sadun AA, Sebag J. Quantitative analysis of central visual field defects in macular edema using three-dimensional computer-automated threshold Amsler grid testing. Graefe's archive for clinical and experimental ophthalmology = Albrecht von Graefes Archiv fur klinische und experimentelle Ophthalmologie. 2009 Feb:247(2):165-70. doi: 10.1007/s00417-008-0971-8. Epub 2008 Oct 29 [PubMed PMID: 18958487]
Mursch-Edlmayr AS, Mojon D, Bolz M. [Testing and approach when non-organic visual loss is suspected]. Der Ophthalmologe : Zeitschrift der Deutschen Ophthalmologischen Gesellschaft. 2018 Jan:115(1):77-87. doi: 10.1007/s00347-017-0628-2. Epub [PubMed PMID: 29273864]
Mark HH. The entoptic view of the retinal vessels. Acta ophthalmologica. 2014 May:92(3):e237-40. doi: 10.1111/aos.12192. Epub 2013 Jul 26 [PubMed PMID: 23890291]
Dimitrakos SA. [Entoptic phenomena and potential visual acuity]. Klinische Monatsblatter fur Augenheilkunde. 1999 May:214(5):321-3 [PubMed PMID: 10420377]
Dinkulu S, Kilangalanga NJ, Mukwanseke E, Lutete LF, Hopkins A, Guthoff RF, Stahnke T. Predictive value of retinal function by the Purkinje test in patients scheduled for cataract surgery in Kinshasa, DR Congo. International journal of ophthalmology. 2021:14(9):1392-1395. doi: 10.18240/ijo.2021.09.14. Epub 2021 Sep 18 [PubMed PMID: 34540615]
Lachenmayr B. [Predicting visual acuity in media opacities and uncorrectable refractive errors. Assessing so-called "retinal visual acuity"]. Fortschritte der Ophthalmologie : Zeitschrift der Deutschen Ophthalmologischen Gesellschaft. 1990:87 Suppl():S118-37 [PubMed PMID: 2083891]
Minkowski JS, Palese M, Guyton DL. Potential acuity meter using a minute aerial pinhole aperture. Ophthalmology. 1983 Nov:90(11):1360-8 [PubMed PMID: 6664676]
Level 3 (low-level) evidenceAlio JL, Artola A, Ruiz-Moreno JM, Ismail MM, Ayala MJ. Accuracy of the potential acuity meter in predicting the visual outcome in cases of cataract associated with macular degeneration. European journal of ophthalmology. 1993 Oct-Dec:3(4):189-92 [PubMed PMID: 8142743]
Level 3 (low-level) evidenceSmith BT, Vander JE, Regillo CD, Ho AC. Evaluation of the potential acuity meter in predicting visual acuity after photodynamic therapy for choroidal neovascularization. Ophthalmic surgery, lasers & imaging : the official journal of the International Society for Imaging in the Eye. 2006 Jan-Feb:37(1):6-11 [PubMed PMID: 16468545]
Level 2 (mid-level) evidenceLue CL, Chen SC, Tsai WF. Potential acuity meter for predicting visual acuity after Nd:YAG posterior capsulotomy. Journal of clinical laser medicine & surgery. 1991 Feb:9(1):59-61 [PubMed PMID: 10149445]
Reid O, Maberley DA, Hollands H. Comparison of the potential acuity meter and the visometer in cataract patients. Eye (London, England). 2007 Feb:21(2):195-9 [PubMed PMID: 16273082]
Lotmar W. Use of moiré fringes for testing visual acuity of the retina. Applied optics. 1972 May 1:11(5):1266-8. doi: 10.1364/AO.11.001266. Epub [PubMed PMID: 20119128]
Lotmar W. Apparatus for the measurement of retinal visual acuity by moiré fringes. Investigative ophthalmology & visual science. 1980 Apr:19(4):393-400 [PubMed PMID: 7358490]
Mimouni M, Shapira Y, Jadon J, Frenkel S, Blumenthal EZ. Assessing visual function behind cataract: preoperative predictive value of the Heine Lambda 100 retinometer. European journal of ophthalmology. 2017 Aug 30:27(5):559-564. doi: 10.5301/ejo.5000993. Epub 2017 May 26 [PubMed PMID: 28574134]
Bernth-Petersen P, Naeser K. Clinical evaluation of the Lotmar Visometer for macula testing in cataract patients. Acta ophthalmologica. 1982 Aug:60(4):525-32 [PubMed PMID: 7158317]
Smiddy WE,Thomley ML,Knighton RW,Feuer WJ, Use of the potential acuity meter and laser interferometer to predict visual acuity after macular hole surgery. Retina (Philadelphia, Pa.). 1994; [PubMed PMID: 7817023]
Mankowska ND, Marcinkowska AB, Waskow M, Sharma RI, Kot J, Winklewski PJ. Critical Flicker Fusion Frequency: A Narrative Review. Medicina (Kaunas, Lithuania). 2021 Oct 13:57(10):. doi: 10.3390/medicina57101096. Epub 2021 Oct 13 [PubMed PMID: 34684133]
Level 3 (low-level) evidenceShankar H, Pesudovs K. Critical flicker fusion test of potential vision. Journal of cataract and refractive surgery. 2007 Feb:33(2):232-9 [PubMed PMID: 17276263]
Robson AG, Frishman LJ, Grigg J, Hamilton R, Jeffrey BG, Kondo M, Li S, McCulloch DL. ISCEV Standard for full-field clinical electroretinography (2022 update). Documenta ophthalmologica. Advances in ophthalmology. 2022 Jun:144(3):165-177. doi: 10.1007/s10633-022-09872-0. Epub 2022 May 5 [PubMed PMID: 35511377]
Level 3 (low-level) evidenceHamilton R,Bach M,Heinrich SP,Hoffmann MB,Odom JV,McCulloch DL,Thompson DA, VEP estimation of visual acuity: a systematic review. Documenta ophthalmologica. Advances in ophthalmology. 2021 Feb; [PubMed PMID: 32488810]
Level 3 (low-level) evidenceAbraham FA. A device for easy slitlamp funduscopy with a +90-diopter lens. Ophthalmologica. Journal international d'ophtalmologie. International journal of ophthalmology. Zeitschrift fur Augenheilkunde. 1988:196(1):40-2 [PubMed PMID: 3347469]
Campbell DG. A comparison of diagnostic techniques in angle-closure glaucoma. American journal of ophthalmology. 1979 Aug:88(2):197-204 [PubMed PMID: 474691]
Level 3 (low-level) evidenceFolk JC, Gehrs KM, Kolder HE. Diagnosis of occult lenticular nuclear sclerosis using the Hruby lens. Archives of ophthalmology (Chicago, Ill. : 1960). 1997 Aug:115(8):1086 [PubMed PMID: 9258242]
Level 3 (low-level) evidencePeng J, Zhang Q, Jin HY, Lu WY, Zhao PQ. Ultra-wide field imaging system and traditional retinal examinations for screening fundus changes after cataract surgery. International journal of ophthalmology. 2016:9(9):1299-303. doi: 10.18240/ijo.2016.09.11. Epub 2016 Sep 18 [PubMed PMID: 27672595]
Hans A, Narang S, Sindhu M, Jain S, Chawla D. Fundus fluorescein angiography in retinopathy of prematurity. Eye (London, England). 2022 Aug:36(8):1604-1609. doi: 10.1038/s41433-021-01694-9. Epub 2021 Jul 21 [PubMed PMID: 34290444]
Ruia S, Tripathy K. Fluorescein Angiography. StatPearls. 2024 Jan:(): [PubMed PMID: 35015403]
Le PH, Kaur K, Patel BC. Optical Coherence Tomography Angiography. StatPearls. 2025 Jan:(): [PubMed PMID: 33085382]
Madheswaran G, Nasim P, Ballae Ganeshrao S, Raman R, Ve RS. Role of microperimetry in evaluating disease progression in age-related macular degeneration: a scoping review. International ophthalmology. 2022 Jun:42(6):1975-1986. doi: 10.1007/s10792-021-02170-9. Epub 2022 Jan 7 [PubMed PMID: 34994874]
Level 2 (mid-level) evidenceVianya-Estopà M, Douthwaite WA, Noble BA, Elliott DB. Capabilities of potential vision test measurements: clinical evaluation in the presence of cataract or macular disease. Journal of cataract and refractive surgery. 2006 Jul:32(7):1151-60 [PubMed PMID: 16857502]
Hurst MA, Douthwaite WA. Assessing vision behind cataract--a review of methods. Optometry and vision science : official publication of the American Academy of Optometry. 1993 Nov:70(11):903-13 [PubMed PMID: 8302526]
Lasa MS, Datiles MB 3rd, Freidlin V. Potential vision tests in patients with cataracts. Ophthalmology. 1995 Jul:102(7):1007-11 [PubMed PMID: 9121743]
Schuchard RA. Validity and interpretation of Amsler grid reports. Archives of ophthalmology (Chicago, Ill. : 1960). 1993 Jun:111(6):776-80 [PubMed PMID: 8512478]
Talbot EM, Murdoch JR, Keating D. The Purkinje vascular entoptic test: a halogen light gives better results. Eye (London, England). 1992:6 ( Pt 3)():322-5 [PubMed PMID: 1446770]
Level 3 (low-level) evidenceLanda E, Rehany U, Rumelt S. Visual functions following recovery from non-arteritic central retinal artery occlusion. Ophthalmic surgery, lasers & imaging : the official journal of the International Society for Imaging in the Eye. 2004 Mar-Apr:35(2):103-8 [PubMed PMID: 15088819]
Davis J, Hsieh YH, Lee HC. Humans perceive flicker artifacts at 500 Hz. Scientific reports. 2015 Feb 3:5():7861. doi: 10.1038/srep07861. Epub 2015 Feb 3 [PubMed PMID: 25644611]
Brown B. Structural and functional imaging of the retina: new ways to diagnose and assess retinal disease. Clinical & experimental optometry. 2008 Nov:91(6):504-14. doi: 10.1111/j.1444-0938.2008.00322.x. Epub [PubMed PMID: 18976421]
Level 3 (low-level) evidenceSegato T, Piermarocchi S, Midena E. The role of fluorescein angiography in the interpretation of optic nerve head diseases. Metabolic, pediatric, and systemic ophthalmology (New York, N.Y. : 1985). 1990:13(2-4):111-4 [PubMed PMID: 2079901]
Acton JH, Greenstein VC. Fundus-driven perimetry (microperimetry) compared to conventional static automated perimetry: similarities, differences, and clinical applications. Canadian journal of ophthalmology. Journal canadien d'ophtalmologie. 2013 Oct:48(5):358-63. doi: 10.1016/j.jcjo.2013.03.021. Epub 2013 Sep 2 [PubMed PMID: 24093180]
Hatef E, Hanout M, Moradi A, Colantuoni E, Bittencourt M, Liu H, Sepah YJ, Ibrahim M, Do DV, Guyton DL, Nguyen QD. Longitudinal comparison of visual acuity as measured by the ETDRS chart and by the potential acuity meter in eyes with macular edema, and its relationship with retinal thickness and sensitivity. Eye (London, England). 2014 Oct:28(10):1239-45. doi: 10.1038/eye.2014.182. Epub 2014 Aug 8 [PubMed PMID: 25104744]
Level 2 (mid-level) evidenceFriberg TR, Eller AW. Prediction of visual recovery after scleral buckling of macula-off retinal detachments. American journal of ophthalmology. 1992 Dec 15:114(6):715-22 [PubMed PMID: 1463041]
Stewart WC, Connor AB, Hunt HH. Prediction of postoperative visual acuity in patients with total glaucomatous cupping using the Potential Acuity Meter and automated perimetry. Ophthalmic surgery. 1993 Nov:24(11):730-4 [PubMed PMID: 8290210]
Fish GE, Birch DG, Fuller DG, Straach R. A comparison of visual function tests in eyes with maculopathy. Ophthalmology. 1986 Sep:93(9):1177-82 [PubMed PMID: 3808628]
Bloom TD,Fishman GA,Traubert BS, Laser interferometric visual acuity in senile macular degeneration. Archives of ophthalmology (Chicago, Ill. : 1960). 1983 Jun; [PubMed PMID: 6860206]